Monitoring history
The LCDB v5.0 data used to derive this indicator update was primarily derived from satellite imagery acquired during the summer of 2018/19. More information is available from the dedicated Land Cover Database.
Guidelines and standards
We use geographic information system (GIS) tools to calculate the extent of land use types within the Waikato region.
This indicator re-categorises the LCDB v5.0 land cover classes in the table below into six major land use types in the Waikato region. The table below shows the categories of land use type derived from land cover class.
| LCDB5 Class |
Land use type |
| Not land |
Other |
| Built up Area (settlement) |
Urban |
| Urban Parkland/ Open space |
Urban |
| Transport Infrastructure |
Other |
| Surface Mine or Dump |
Other |
| Sand or Gravel |
Other |
| Landslide |
Other |
| Permanent Snow and Ice |
Other |
| Gravel or Rock |
Other |
| Alpine Grass/Herbfield |
Indigenous vegetation |
| Lake or Pond |
Other |
| River |
Other |
| Estuarine Open Water |
Other |
| Short-rotation Cropland |
Horticultural and cropping |
| Orchard, Vineyard or Other Perennial Crop |
Horticultural and cropping |
| High Producing Exotic Grassland |
Pastoral farming |
| Low Producing Grassland |
Pastoral farming |
| Tall Tussock Grassland |
Indigenous vegetation |
| Depleted Grassland |
Indigenous vegetation |
| Herbaceous Freshwater Vegetation |
Indigenous vegetation |
| Herbaceous Saline Vegetation |
Indigenous vegetation |
| Flaxland |
Indigenous vegetation |
| Fernland |
Indigenous vegetation |
| Gorse and/or Broom |
Other |
| Manuka and/or Kanuka |
Indigenous vegetation |
| Broadleaved Indigenous Hardwoods |
Indigenous vegetation |
| Sub Alpine Shrubland |
Indigenous vegetation |
| Mixed Exotic Shrubland |
Other |
| Matagouri or Grey Shrub |
Indigenous vegetation |
| Mangrove |
Indigenous vegetation |
| Forest- Harvested |
Plantation forestry |
| Deciduous Hardwoods |
Other |
| Indigenous Forest |
Indigenous vegetation |
| Exotic Forest |
Plantation forestry |
Limitations
The LCDB gives a regional scale ‘snapshot’ of vegetation when the data were collected and should not be considered the definitive current vegetation cover.
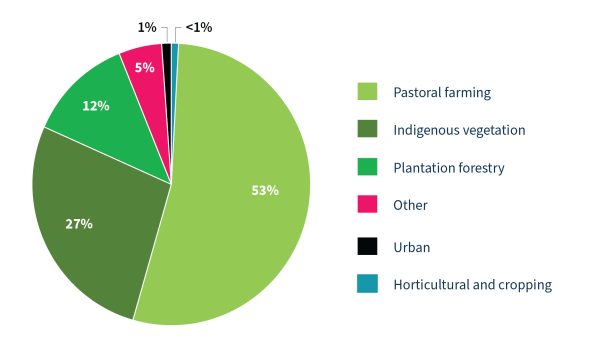
The data were presented as percentage of total land area in the region by major land use type. However, the data do not allow for a breakdown of land use type by activity, for example, separating pastoral farming into different types such as dairy farming or sheep and beef farming.
Further indicator developments
In future this indicator may potentially be expanded to further delineate different land use classes and enterprise types such as dairy, drystock, and cropping.
Monitoring sites
We measure the area in different land use types for the entire Waikato region.
Monitoring frequency
The Ministry for the Environment intends to update the LCDB every 5 years. Waikato Regional Council's monitoring of changes in land use is dependent on the release of the updated LCDB datasets by the Ministry for the Environment.
Quality control procedures
For information on data quality (lineage, positional accuracy, attribute accuracy, logical consistency and completeness) see the updated metadata for the LCDB available from the dedicated Land Cover Database (metadata).
Footnotes
- The LCDB v5.0 dataset is a “public good” data set created by Landcare Research New Zealand Ltd and available under Creative Commons Attribution V4.0 International Licensing.
- New Zealand Land Cover Database User Guide.